Call Spread Strategy: Using Gamma to Find Price Breakout Zones
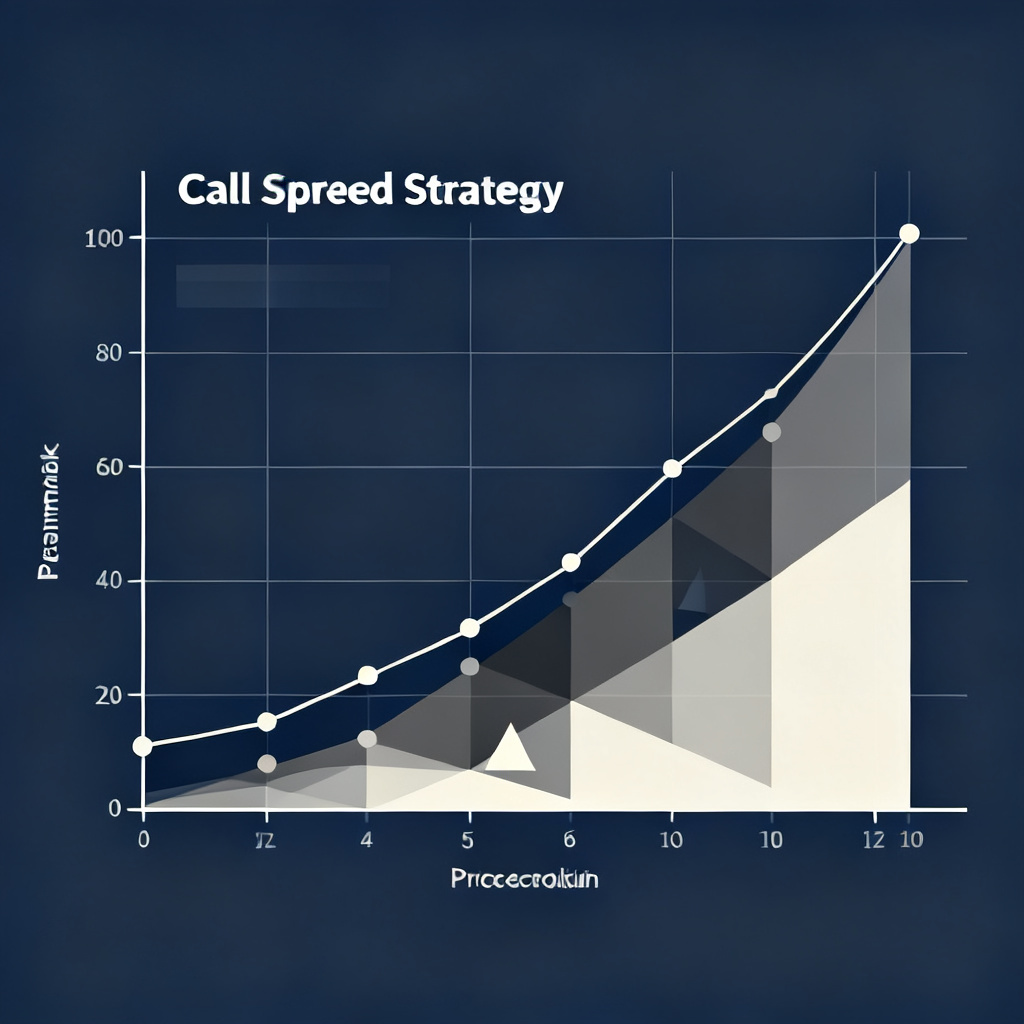
Most traders think of call spreads as defined-risk, directional bets. But beyond the basic mechanics of buying one call and selling another, there's a deeper layer of market intelligence embedded in these positions. A call spread strategy, particularly when analyzed through the lens of gamma exposure, can act as a sophisticated radar, mapping out the precise price zones where a stock is most likely to accelerate or reverse. This post will explore how traders can use bull call spreads and bear call spreads not just to profit, but to predict.
Call Spreads 101: More Than Just Direction
Before we dive into gamma, let's establish a common understanding of the core strategies. A call spread involves two call options on the same underlying asset with the same expiration date but different strike prices.
Bull Call Spread (Debit Call Spread)
This is a net-long, bullish strategy. You buy a lower strike call and sell a higher strike call. You pay a net debit, which is your maximum potential loss. Your maximum profit is the difference between the strikes minus the debit paid. It's a classic way to finance a long call position by selling another call to reduce cost.
Bear Call Spread (Credit Call Spread)
This is a net-short, bearish or neutral strategy. You sell a lower strike call and buy a higher strike call. You receive a net credit, which is your maximum profit. Your maximum loss is the difference between the strikes minus the credit received. It's structurally identical to a bull put spread, just using calls. This is a crucial point: the risk profile of a bear call spread is identical to that of a bull put spread at the same strikes.
The Hidden Map: Gamma Exposure (GEX) and Pinning
Gamma measures the rate of change of an option's delta. In simpler terms, it's the acceleration of an option's price sensitivity. High gamma near a strike price means the delta (and thus the effective hedge position of market makers) changes rapidly as the stock price moves.
When a large volume of options exists at a specific strike—like the short strike in a popular call spread—market makers who have sold those options to the public must hedge their risk. They do this by buying or selling shares of the underlying stock. Their collective hedging activity creates "pinning" forces that can pull the stock price toward these high-option-volume strikes as expiration approaches.
Mapping Breakout Zones with Call Spreads
A dense cluster of short call options (like those sold in bear call spreads or as part of bull call spreads) creates negative gamma exposure for market makers. In this zone, if the stock price rises, they are forced to buy shares to stay hedged (because their short calls go deeper in-the-money, making them shorter delta). This buying can fuel an upward move. Conversely, if the price falls from that zone, they are forced to sell shares, exacerbating the drop.
This phenomenon creates "breakout zones." A stock approaching a wall of short calls may experience:
- Resistance & Reversal: The initial hedging pressure might act as a ceiling. This is the classic "max pain" or pinning effect.
- Accelerated Breakout: If the stock price is pushed through that strike with enough force (e.g., by a strong earnings report), the resulting hedging (market makers buying to cover) can create a rapid, gamma-squeeze-driven move to the next significant strike. This is the breakout.
The area just above a large short call strike is often a high-probability zone for a fast price move if breached.
Practical Example: Trading the Gamma Map
Let's say stock XYZ is trading at $100. Option chain analysis reveals an unusually high open interest at the $105 call strike for the monthly expiration, largely from bear call spreads ($105/$110) and covered calls. The $110 strike also has significant open interest.
As a trader, you interpret this data:
- The
$105strike is a major negative gamma zone (lots of short calls). - The path of least resistance below
$105is down (due to dealer hedging selling). - A sustained move above
$105could trigger a swift move toward$110as dealers buy stock to hedge.
Your strategic playbook could include:
Scenario 1: Pre-Breakout (Stock at $100)
You suspect it will be pinned below $105. You could initiate a bear call spread by selling the $105 call and buying the $110 call for a credit. You're betting the gamma pinning effect holds, and the spread expires worthless.
Scenario 2: On a Breakout Attempt (Stock pushing $104.50)
You believe the buying pressure is genuine and a gamma squeeze above $105 is likely. Instead of chasing the stock, you could enter a bull call spread targeting the next gamma wall. For example, buy the $105 call, sell the $110 call. This spread is cheap if the stock is still below $105, but its value could explode if the stock gets pinned or squeezes toward $110.
Connecting to Credit Put Spreads
Remember, a bear call spread ($105/$110) has the exact same payoff diagram as a bull put spread at the same strikes ($105/$100 put spread). So, the gamma exposure from a bear call spread at $105 is mirrored by the gamma exposure from a bull put spread with a short put at $105. Analyzing call spreads gives you insight into the forces affecting the equivalent popular credit put spread positions. If everyone is selling $105 put spreads, it creates the same gamma pinning effect at $105 as everyone selling $105 call spreads.
Key Takeaways for Your Call Spread Strategy
1. Call Spreads Are Sentiment Gauges: High open interest at certain call strikes, especially from multi-leg spreads, reveals where the crowd has placed its bullish or bearish bets.
2. Gamma Creates Walls and Ramps: Dense short call positions create price zones (negative gamma) that can act as both resistance and, if broken, launchpads.
3. Strategic Adaptation: Use bear call spreads to profit from predicted pinning below a high-gamma strike. Use bull call spreads to cheaply position for a potential gamma squeeze above it.
4. The Dealer Hedging Feedback Loop is Real: This isn't just theory. As weekly and monthly options expiration approaches, this hedging activity is a primary driver of short-term price action.
Conclusion
A call spread strategy, when viewed through the lens of gamma exposure, transforms from a simple directional tool into a sophisticated market map. By identifying where large volumes of call spreads—both bull and bear—are clustered, you can predict zones of increased volatility and pinpoint high-probability breakout or breakdown levels. Whether you're trading a bull call spread for a breakout or a bear call spread for a pin, understanding the underlying gamma dynamics gives you an edge in forecasting not just where the price might go, but how quickly it might get there. Start by analyzing the open interest on your favorite stocks before their next expiration; you might see the market's next move drawn plainly in the options chain.