IV Rank Distortion: The Hidden Earnings Season Trap for Spreads
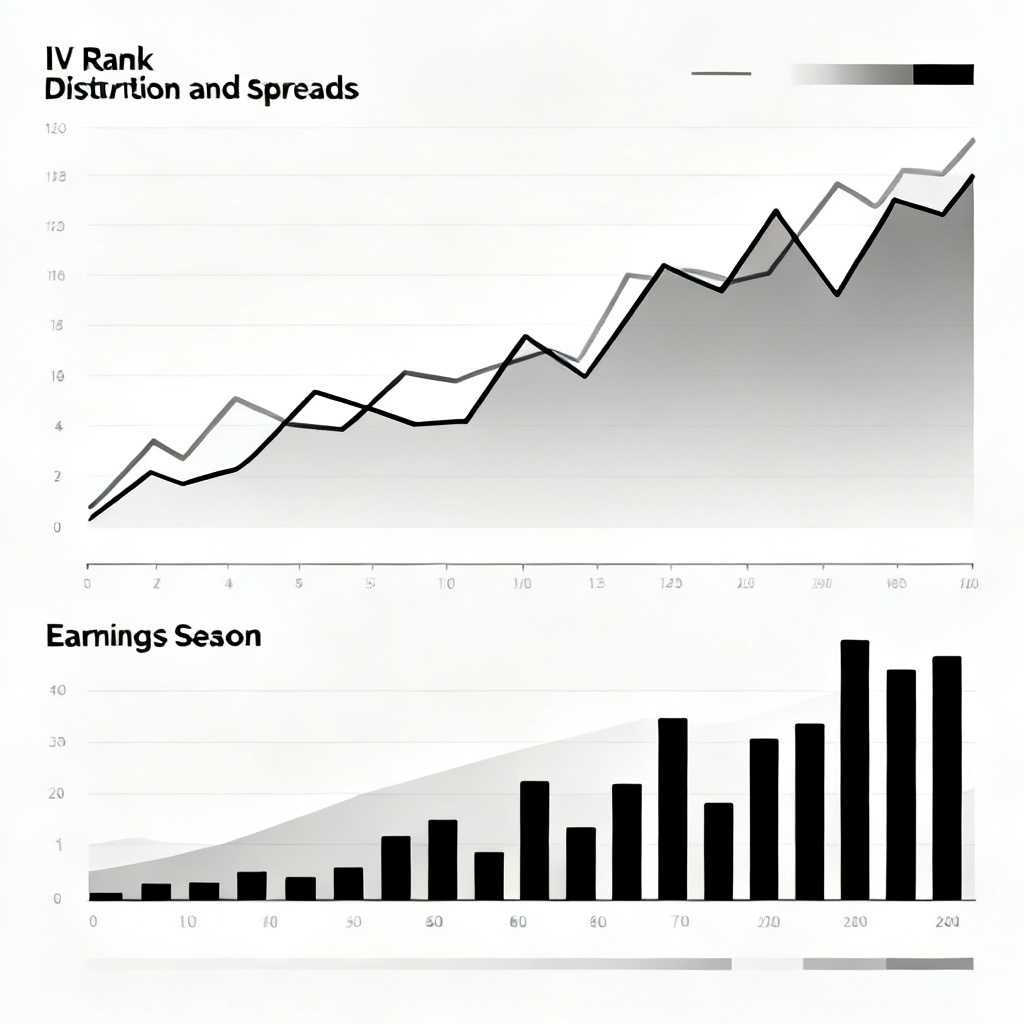
As an options trader, you're likely familiar with IV Rank (Implied Volatility Rank) as a go-to metric for identifying high-volatility environments ripe for selling premium. It's a cornerstone of many credit spread strategies. But what if this trusted gauge was giving you dangerously false readings half the time? During earnings season, that's exactly what happens. This post will dissect the distortion of IV Rank around corporate events and provide a framework for smarter credit put spread selection.
The Allure and Fundamental Flaw of Standard IV Rank
IV Rank tells you where current implied volatility sits relative to its own historical range over the past year. A rank of 80% means IV is higher than it has been 80% of the time. For sellers of credit spreads, a high IV Rank signals potentially inflated option premiums, which translates to more credit received for the same width of spread. The logic is sound: sell high volatility, await a reversion to the mean, and profit from IV crush.
However, the classic IV Rank calculation has a critical blind spot: it doesn't differentiate between "organic," market-wide volatility and "event-driven," company-specific volatility—namely, earnings announcements. A stock's implied volatility naturally spikes in the days and weeks leading up to its quarterly report. This spike gets baked into the IV Rank calculation, artificially pumping the number. A stock showing an IV Rank of 90% might not be in a generically volatile period but is simply one week away from announcing earnings.
Why This Distortion Is a Credit Spread Killer
For a credit put spread seller, this distortion creates a perfect trap. You see a juicy, high-IV Rank, sell a put spread to collect a fat premium, and then get hammered not by a market move, but by an earnings surprise.
The problem is twofold:
- Misleading "High" Premium: The credit you receive is high because it's pricing in the binary risk of the earnings move. It's not compensation for general volatility risk; it's compensation for event risk. The odds are stacked against you.
- Post-Earnings IV Crush Works Against You: While you do get the inevitable
IV crushafter the report, the underlying stock price can gap through your short strike overnight. A massive IV drop does nothing to save you from a catastrophic price move. Your spread can go to max loss instantly, with no time to manage the position.
A Practical Example: The AAPL Trap
Imagine it's late April. Apple (AAPL) is set to report earnings in one week. Its 30-day implied volatility has surged from 20% to 45%. Its one-year IV Range is 18% to 50%. Current IV of 45% gives it an IV Rank of approximately (45-18)/(50-18) = 84%. This looks fantastic for a premium seller.
You sell a 2-week out AAPL $165/$160 put credit spread for a $1.50 credit. AAPL is trading at $170. The trade has a high probability of success if the stock stays flat or rises. However, earnings are in 7 days. Post-earnings, IV collapses from 45% to 25%, but the stock gaps down to $158 on a revenue miss. Your short $165 put is now deep in the money. The IV crush helped your long $160 put lose value, but not enough. You face nearly the full max loss of $3.50 ($5.00 width - $1.50 credit). The high IV Rank led you into an earnings gamble, not a statistical edge.
Adjusting Your Toolkit: IV Percentile and Volatility Skew
To avoid this trap, you need more nuanced metrics. Enter IV Percentile and Volatility Skew.
Using IV Percentile as a Filter
IV Percentile answers a different question: "What percentage of days over the past year was implied volatility at or *below* its current level?" An IV Percentile of 80% means IV is at the high end of its range, similar to a high IV Rank. However, because the calculation examines the entire daily history, a single, sharp earnings spike has less distorting power. A stock with consistently elevated IV will have a high IV Percentile, while a stock with a one-off spike might not. Use IV Percentile *in addition to* IV Rank. If Rank is high (80+) but Percentile is middling (40-60), it's a red flag for an earnings or event-driven spike.
Reading the Volatility Skew for Clues
The volatility skew—the difference in implied volatility across strike prices—becomes incredibly telling near earnings. In a typical market, put options often have higher IV than calls due to the "fear premium." Around earnings, this can become extreme.
How to use it: Look at the IV for options at your proposed short strike versus those 20-30 points out-of-the-money. If the IV for near-the-money puts is drastically higher than for far OTM puts, the market is specifically pricing in high risk of a significant drop. This is a clear signal that the high premium you're seeing is event-risk compensation, not a general volatility sell signal. It's often wiser to avoid selling spreads at strikes where the skew is steepest.
A Modified Credit Put Spread Selection Process
Here is a step-by-step checklist to apply during earnings season (or any single-stock event period):
- Check the Earnings Calendar: This is non-negotiable. Always know the next report date for any underlying you're trading. Avoid selling credit spreads that expire before or within 1-3 days after an earnings report.
- Compare IV Rank and IV Percentile: Use a platform that shows both. Be wary of large discrepancies where Rank is significantly higher than Percentile.
- Analyze the Term Structure & Skew: Look at the IV across expiration dates. Is the front-month IV massively elevated compared to the back months? That's the earnings bubble. Also, examine the skew at your intended strike. An extreme skew is a warning sign.
- Select Expirations Strategically: If you still like the stock but want to avoid earnings, sell credit spreads in a further-dated expiration cycle (e.g., 60-90 days out). This allows you to capture still-elevated IV but gives the stock time to recover from any post-earnings gap. You must be prepared to manage the position through the event.
- Default to Index or ETF Spreads: During peak earnings season, consider shifting focus to broad-based ETFs like SPY, IWM, or QQQ. Their IV is an average of hundreds of components, so single earnings reports don't cause the same distortive spikes. Their IV Rank/Percentile readings are often more reliable.
Conclusion: Trade the Cycle, Not Just the Number
IV Rank is a powerful tool, but it's not omniscient. It treats all volatility as equal, and in the options market, context is everything. Earnings season systematically distorts this metric, creating tempting but hazardous setups for credit spread sellers. By incorporating earnings dates, IV Percentile, and skew analysis into your process, you transform from a passive number-follower into an active risk manager. You'll stop selling expensive lottery tickets disguised as high-probability spreads and start placing trades where the true statistical edge—the kind built on mean reversion of general market volatility, not binary events—is on your side. Remember, the goal isn't just to sell high IV; it's to sell high IV that is likely to fall for the right reasons.