Reading Bearish Engulfing Patterns for Credit Spread Entry
Reading Bearish Engulfing Patterns: A Catalyst for Credit Put Spread Entry
In the world of technical analysis, few signals are as visually compelling and conceptually straightforward as the bearish engulfing pattern. For options traders, particularly those utilizing defined-risk strategies like credit spreads, these candlestick formations are not just a sign of potential trouble—they can be a golden ticket. When you master reading these patterns, you can transform a simple observation of shifting momentum into a structured, high-probability trade. This guide will break down the bearish engulfing pattern and demonstrate precisely how it can serve as your catalyst for entering a profitable credit put spread.
What is a Bearish Engulfing Pattern?
At its core, a bearish engulfing pattern is a two-candlestick reversal signal that typically appears at the end of an uptrend. It’s a story told in the conflict between bulls and bears, visualized on your chart.
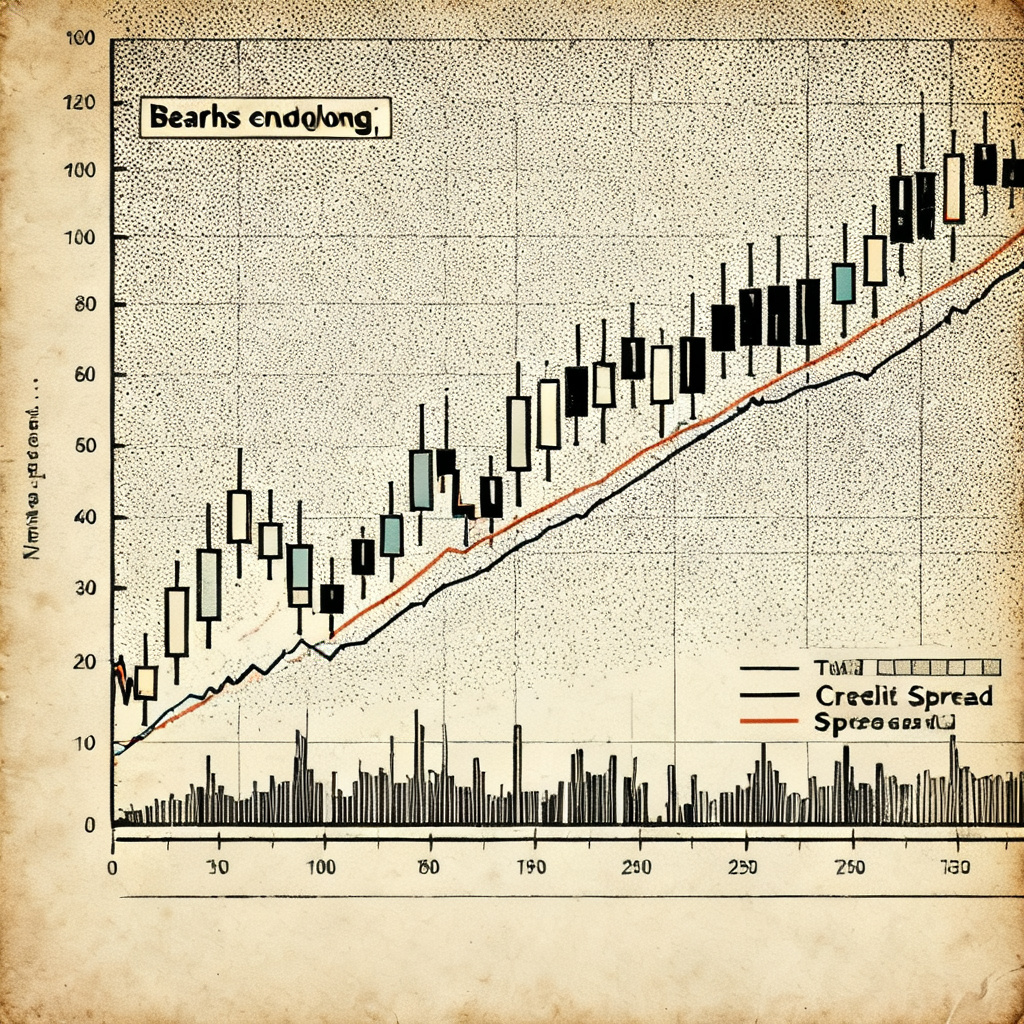
- The First Candle: A bullish (green or white) candle that reflects the prevailing upward momentum.
- The Second Candle: A larger bearish (red or black) candle that opens above the previous close and closes below the previous open. This second candle completely "engulfs" the real body of the first candle.
The psychology is clear: the bulls start the session strong, pushing the price to a higher open. However, the bears seize control with overwhelming force, driving the price down so decisively that it erases all of the prior day's gains and then some. This shift in power suggests the uptrend may be exhausting itself.
Why It's a Powerful Signal for Options Sellers
For traders who sell options to collect premium, like with credit spreads, timing is about probability. We want to sell options when the underlying asset is less likely
- Identifies Potential Resistance: The pattern often marks a local or interim top, creating a clear
resistance level. This is a price zone where selling pressure has proven dominant. - Signals Short-Term Momentum Shift: It doesn't necessarily forecast a long-term crash, but it strongly suggests a pause or pullback is imminent. This is the perfect environment for a bearish-to-neutral strategy.
- Offers a Clear Reference Point: The high of the engulfing candle becomes a logical level for placing stop-losses or gauging trade invalidation. It provides a concrete technical reason for entering a trade, moving beyond guesswork.
From Pattern to Trade: The Credit Put Spread Entry
Seeing the pattern is step one. The art is in translating that signal into a mechanical, high-probability credit put spread (also known as a bull put spread) entry. This strategy involves selling a put option at a higher strike price and buying a put at a lower strike price, both with the same expiration. You receive a net credit, and your maximum profit is that credit if the stock stays above the short put strike at expiration.
Here’s your actionable playbook:
Step 1: Confirmation and Context
Never trade a pattern in isolation. The bearish engulfing candle must close. Then, assess its location.
- Is it forming near a known
resistance levelon a higher time frame (e.g., daily or weekly)? - Is the Relative Strength Index (RSI) showing overbought conditions (above 70)?
- Is there a divergence between price making higher highs and an indicator like the MACD making lower highs?
If the answer to any of these is yes, the signal's strength is amplified. You're not catching a falling knife; you're identifying a high-probability area for a stall or decline.
Step 2: Selecting Your Strikes
This is where the pattern gives you a tactical edge. The bearish engulfing pattern suggests the price is likely to move sideways or down from that level.
- Identify Key Support: Look for the nearest major
support levelbelow the current price. This could be a previous swing low, a moving average (like the 50-day SMA), or a psychological price level. - Place Your Short Put: Sell the put option at a strike price at or below that identified support level. Your analysis says the price is unlikely to break below this support in the short term.
- Buy Your Long Put: Buy the put option at a lower strike (typically 1-2 strikes down) to define your risk. The width of the spread determines your maximum risk.
You are essentially selling insurance (the put) against a decline, but the bearish engulfing pattern tells you the odds of a severe decline that breaches your support are now lower, making that insurance premium attractive to collect.
Step 3: Real-World Example with XYZ Stock
Let's assume XYZ stock has rallied from $100 to $120 over several weeks. It approaches a historical resistance zone at $122.
- Day 1: XYZ closes at $121 (bullish candle).
- Day 2: XYZ opens at $121.50, but selling erupts. It closes at $119, creating a clear bearish engulfing candle that swallows Day 1's body. The RSI is at 75.
The Trade: With the pattern confirming resistance, you look for support. The 50-day SMA is at $115, and a prior swing low sits at $114.
You decide to sell a credit put spread 30 days out:
SELL 1 XYZ $115 Put for $2.00
BUY 1 XYZ $110 Put for $0.50
Net Credit: $1.50 per spread.
Your maximum profit is $150 per spread if XYZ stays above $115 at expiration. Your maximum loss is $350 ($5 spread width - $1.50 credit) if XYZ falls below $110. The engulfing pattern gave you the confidence that a retreat to $115 is plausible, but a crash through $110 is unlikely, making the risk/reward favorable.
Risk Management: The Engulfing Candle is Your Guide
The pattern itself provides natural risk parameters. A cardinal rule when using this signal for credit spreads: the bearish engulfing pattern must not be invalidated.
Your Trade Invalidation Level: The high of the bearish engulfing candle. If the stock price rallies back above this level, the reversal signal has failed. The bears who created the pattern have been overwhelmed. At this point, the rationale for your trade is broken, and you should strongly consider closing the position for a small loss rather than letting it turn into a larger one.
Furthermore, always manage position size. A credit put spread's risk is defined, but risking no more than 1-5% of your trading capital on any single idea is a fundamental discipline that keeps you in the game.
Advanced Considerations: Combining with Key Levels
To elevate your trading, always cross-reference the bearish engulfing pattern with major key levels.
- Confluence with Resistance: A bearish engulfing pattern that forms right at a major trendline resistance or a horizontal price resistance level is a powerhouse signal. It shows selling pressure at a precise, pre-identified zone.
- Volume Matters: A high-volume engulfing candle indicates strong conviction from the sellers, adding credibility to the reversal.
- Time Frame Alignment: A bearish engulfing on the daily chart is more significant if it also appears on a weekly chart pullback. Multi-timeframe confirmation dramatically increases the signal's reliability.
Conclusion: A Structured Approach to Market Shifts
Reading bearish engulfing patterns is more than just recognizing a candlestick shape. It's about understanding a shift in auction market psychology and having a pre-defined, mechanical strategy to act on it. For the credit spread trader, this pattern offers a clear "why" for entering a position. It allows you to move from reactive gambling to proactive, probability-based trading. By waiting for these patterns to form at logical resistance areas, selecting strikes based on nearby support, and using the pattern's own structure to manage risk, you turn a simple chart observation into a robust trading edge. Start scanning for these engulfing signals on your charts—your next high-probability credit put spread entry might be just one candle away.